
Disaster Recovery Planning: RTO and RPO Explained
Issue #116: System Design Interview Roadmap • Section 5: Reliability & Resilience
The $100 Million Question
Your payment system just crashed. Credit card transactions are failing worldwide. Every second of downtime costs $50,000 in lost revenue. Your CEO is asking two critical questions: "How long until we're back online?" and "How much transaction data did we lose?"
These questions reveal the two most important metrics in disaster recovery: Recovery Time Objective (RTO) and Recovery Point Objective (RPO). Understanding these isn't just about passing interviews—it's about building systems that survive real disasters.
What We'll Master Today
RTO vs RPO fundamentals and why they drive architecture decisions
Calculating meaningful objectives based on business impact
Implementation strategies for different system tiers
Real-world case studies from Netflix and financial services
Hands-on simulation of disaster recovery scenarios
RTO and RPO: The Foundation Metrics
Recovery Time Objective (RTO) answers: "How long can our system be down before it seriously hurts the business?" This drives your disaster recovery speed requirements.
Recovery Point Objective (RPO) answers: "How much data loss can we tolerate?" This drives your backup and replication strategies.
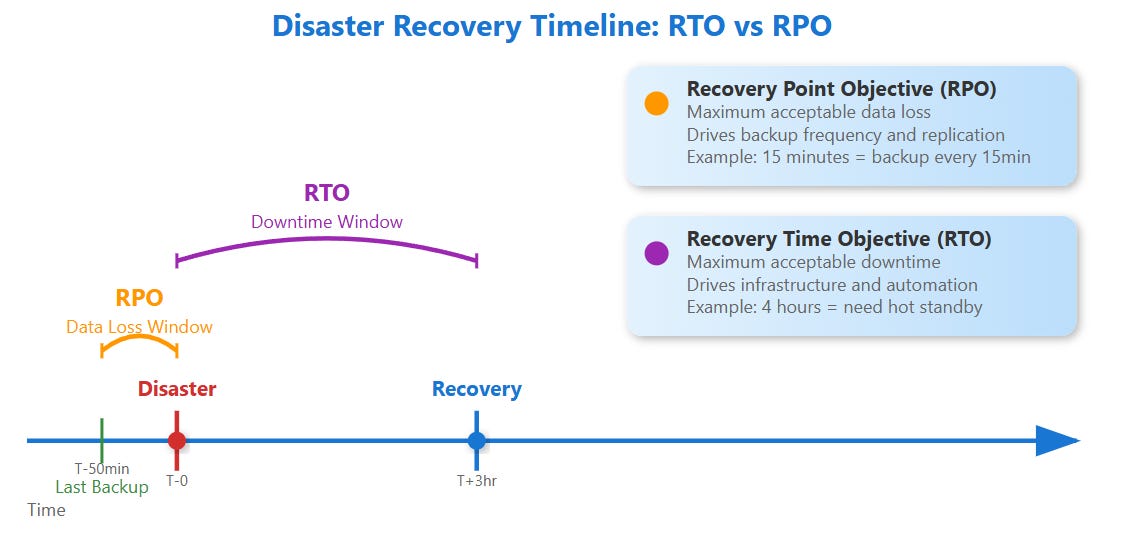
Think of RTO as your "pain threshold" for downtime, while RPO is your "pain threshold" for data loss. A banking system might have RTO=2 minutes and RPO=0 seconds (no data loss allowed), while a social media feed might accept RTO=30 minutes and RPO=1 hour.
The Business Impact Mathematics
Here's what most engineers miss: RTO and RPO aren't technical decisions—they're business decisions with technical implementations.
RTO Calculation Framework:
Revenue per minute during peak hours
Customer abandonment rates after X minutes of downtime
Regulatory penalties for extended outages
Brand reputation impact costs
RPO Calculation Framework:
Value of data created per minute
Cost of recreating lost data
Compliance requirements for data retention
Customer trust impact from data loss
Netflix discovered their optimal RTO varies by service tier: 30 seconds for video streaming, 5 minutes for recommendations, 1 hour for analytics. This tiered approach saves millions in infrastructure costs while maintaining user experience.
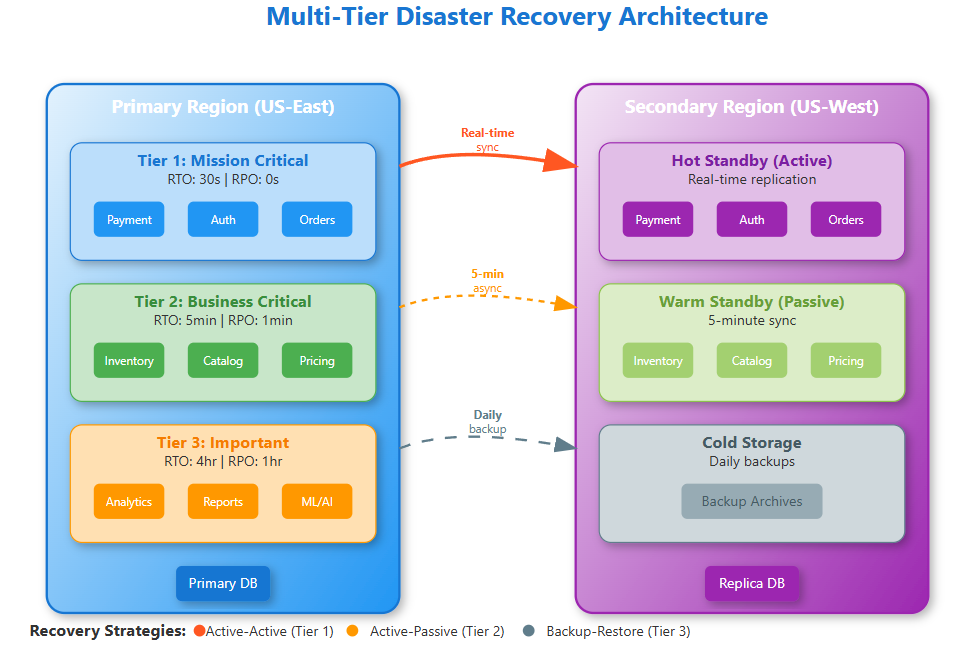
Implementation Strategies by System Tier
Tier 1: Mission-Critical (RTO < 5 minutes, RPO < 1 minute)
Active-Active Replication: Systems run simultaneously in multiple regions with real-time data synchronization. Payment processors use this pattern—Chase Bank maintains identical transaction databases across three data centers with microsecond synchronization.
Implementation Pattern:
# Synchronous replication to multiple regions
async def write_critical_data(data):
    tasks = [
        write_to_region_1(data),
        write_to_region_2(data),
        write_to_region_3(data)
    ]
    # Wait for majority consensus
    await asyncio.gather(*tasks)
Tier 2: Business-Critical (RTO < 30 minutes, RPO < 15 minutes)
Active-Passive with Hot Standby: Primary region serves traffic while secondary regions maintain warm replicas. When primary fails, automatic failover switches traffic to secondary within minutes.
Tier 3: Important (RTO < 4 hours, RPO < 1 hour)
Backup and Restore: Regular snapshots with automated restoration procedures. Cost-effective for systems where some downtime is acceptable.
Advanced Insights: The Hidden Complexities
Cross-Service Dependency Chains
Most RTO calculations ignore dependency cascades. If your authentication service has RTO=5 minutes but depends on a database with RTO=30 minutes, your effective RTO becomes 30 minutes. Map these dependencies early.
Data Consistency During Recovery
The Split-Brain Problem: During failover, both primary and secondary regions might think they're the leader. Use consensus protocols (Raft, Paxos) or external coordination services (etcd, Consul) to prevent dual writes.
Recovery Testing Reality Gap
Untested recovery procedures fail 60% of the time in real disasters. Netflix runs "Chaos Engineering" experiments that randomly terminate entire regions during business hours to validate their recovery procedures.
Real-World Case Study: Stripe's Payment Infrastructure
Stripe processes $640 billion annually with 99.99% uptime. Their disaster recovery strategy reveals production-grade patterns:
Multi-Tier RTO Strategy:
Card tokenization: RTO=30 seconds (hot standby across 3 regions)
Payment processing: RTO=2 minutes (active-active with consensus)
Dispute handling: RTO=4 hours (backup and restore)
RPO Implementation:
Transaction data: RPO=0 (synchronous replication)
Analytics data: RPO=1 hour (asynchronous batch processing)
Logs: RPO=15 minutes (streaming replication with buffering)
Production Monitoring and Alerting
RTO Monitoring: Track actual recovery times during incidents and compare against objectives. Set up automated alerts when recovery procedures take longer than expected.
RPO Monitoring: Measure replication lag in real-time. Alert when data synchronization falls behind RPO thresholds.
# Monitor replication lag
def check_rpo_compliance():
    lag = get_replication_lag_seconds()
    if lag > RPO_THRESHOLD_SECONDS:
        alert_ops_team("RPO violation detected")
Your Implementation Checklist
Week 1: Assessment
Calculate revenue impact per minute of downtime for each service
Map service dependencies and identify critical paths
Document current backup frequencies and restoration times
Week 2: Design
Set RTO/RPO objectives based on business impact analysis
Choose appropriate replication strategies for each tier
Design automated failover procedures with consensus mechanisms
Week 3: Implementation
Build monitoring for replication lag and recovery metrics
Create runbooks for disaster scenarios with step-by-step procedures
Implement automated testing of recovery procedures
The Hands-On Challenge
Build a disaster recovery simulation that demonstrates RTO and RPO concepts across multiple service tiers. The demo includes:
Multi-tier services with different recovery requirements
Real backup and restore functionality with configurable RPO
Failure injection to test recovery procedures
Live dashboard showing recovery metrics and compliance status
This practical exercise reveals the complexity of coordinating recovery across dependent services while maintaining data consistency.
Tomorrow's Architecture Decisions
Understanding RTO and RPO transforms how you design systems. Instead of building for perfect uptime (impossible and expensive), you build for acceptable recovery (achievable and cost-effective).
Next week, we'll explore Multi-Region Failover Strategies, diving deep into the technical implementation of the disaster recovery plans we've designed today.
Quick Demo
git clone https://github.com/sysdr/sdir.git

git checkout disaster_recovery

cd sdir/disaster-recovery-demo

./demo.sh

Open http://localhost:3000

./cleanup.sh
Key Takeaway: RTO and RPO aren't just metrics—they're architectural constraints that determine your replication strategy, infrastructure costs, and monitoring requirements. Master these concepts, and you'll make informed trade-offs between reliability and cost that align with business objectives.