
Log Aggregation at Scale: ELK vs. Splunk vs. Loki Architectures
Sponsored
Build Distritubed Systems using System Design concepts with hands-on coding lessons every day - System Design Course
Preparing for a distributed systems interview?
Introduction
Your production system just went dark at 2:47 AM. Services are returning 503s, customers are screaming, and your on-call engineer is frantically searching through logs scattered across 200 containers on 40 nodes. Without a centralized log aggregation system, every second spent grepping individual machines is a second your system stays broken. Log aggregation isn’t just a nice-to-have — it’s the difference between a 4-minute MTTR and a 4-hour incident.
Core Concept: What Log Aggregation Actually Does
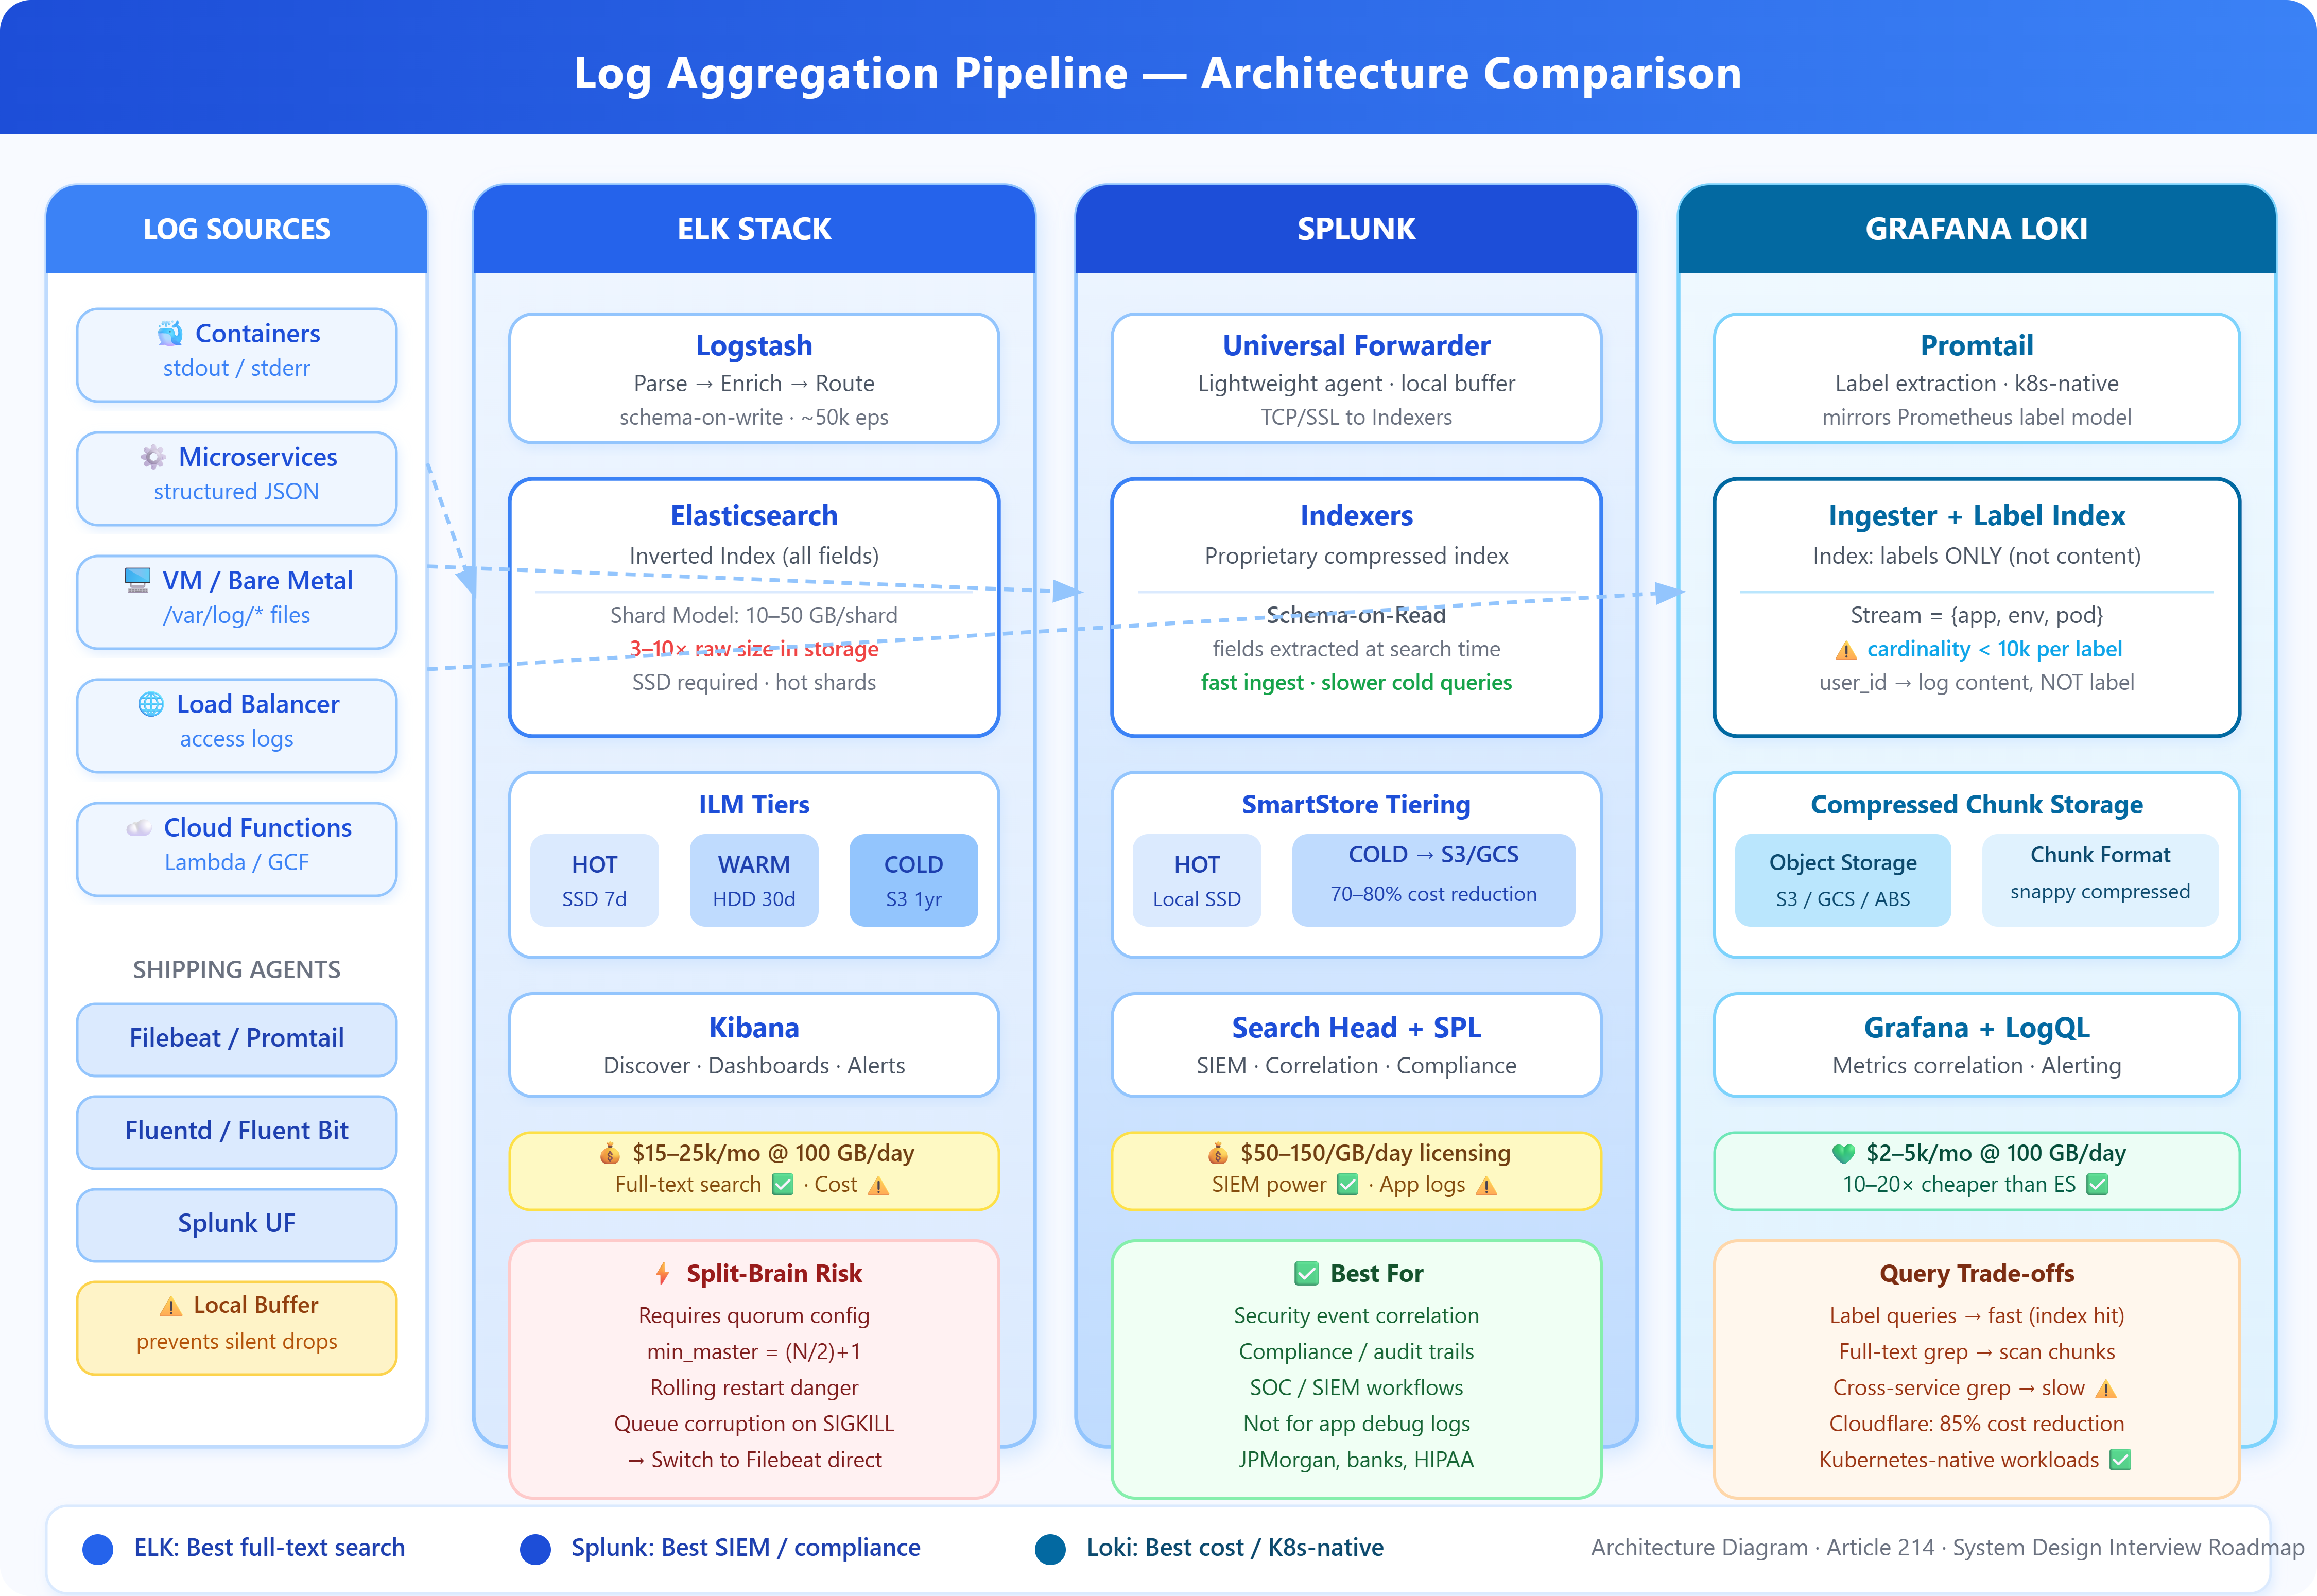
At its core, log aggregation solves a distributed systems problem: your logs are generated everywhere, but your engineers need to query them from one place. Every log aggregation system shares the same pipeline, regardless of branding: collect → ship → parse → index → query.
The architectural divergence happens at indexing and query layers, and those differences have enormous operational and cost consequences at scale.
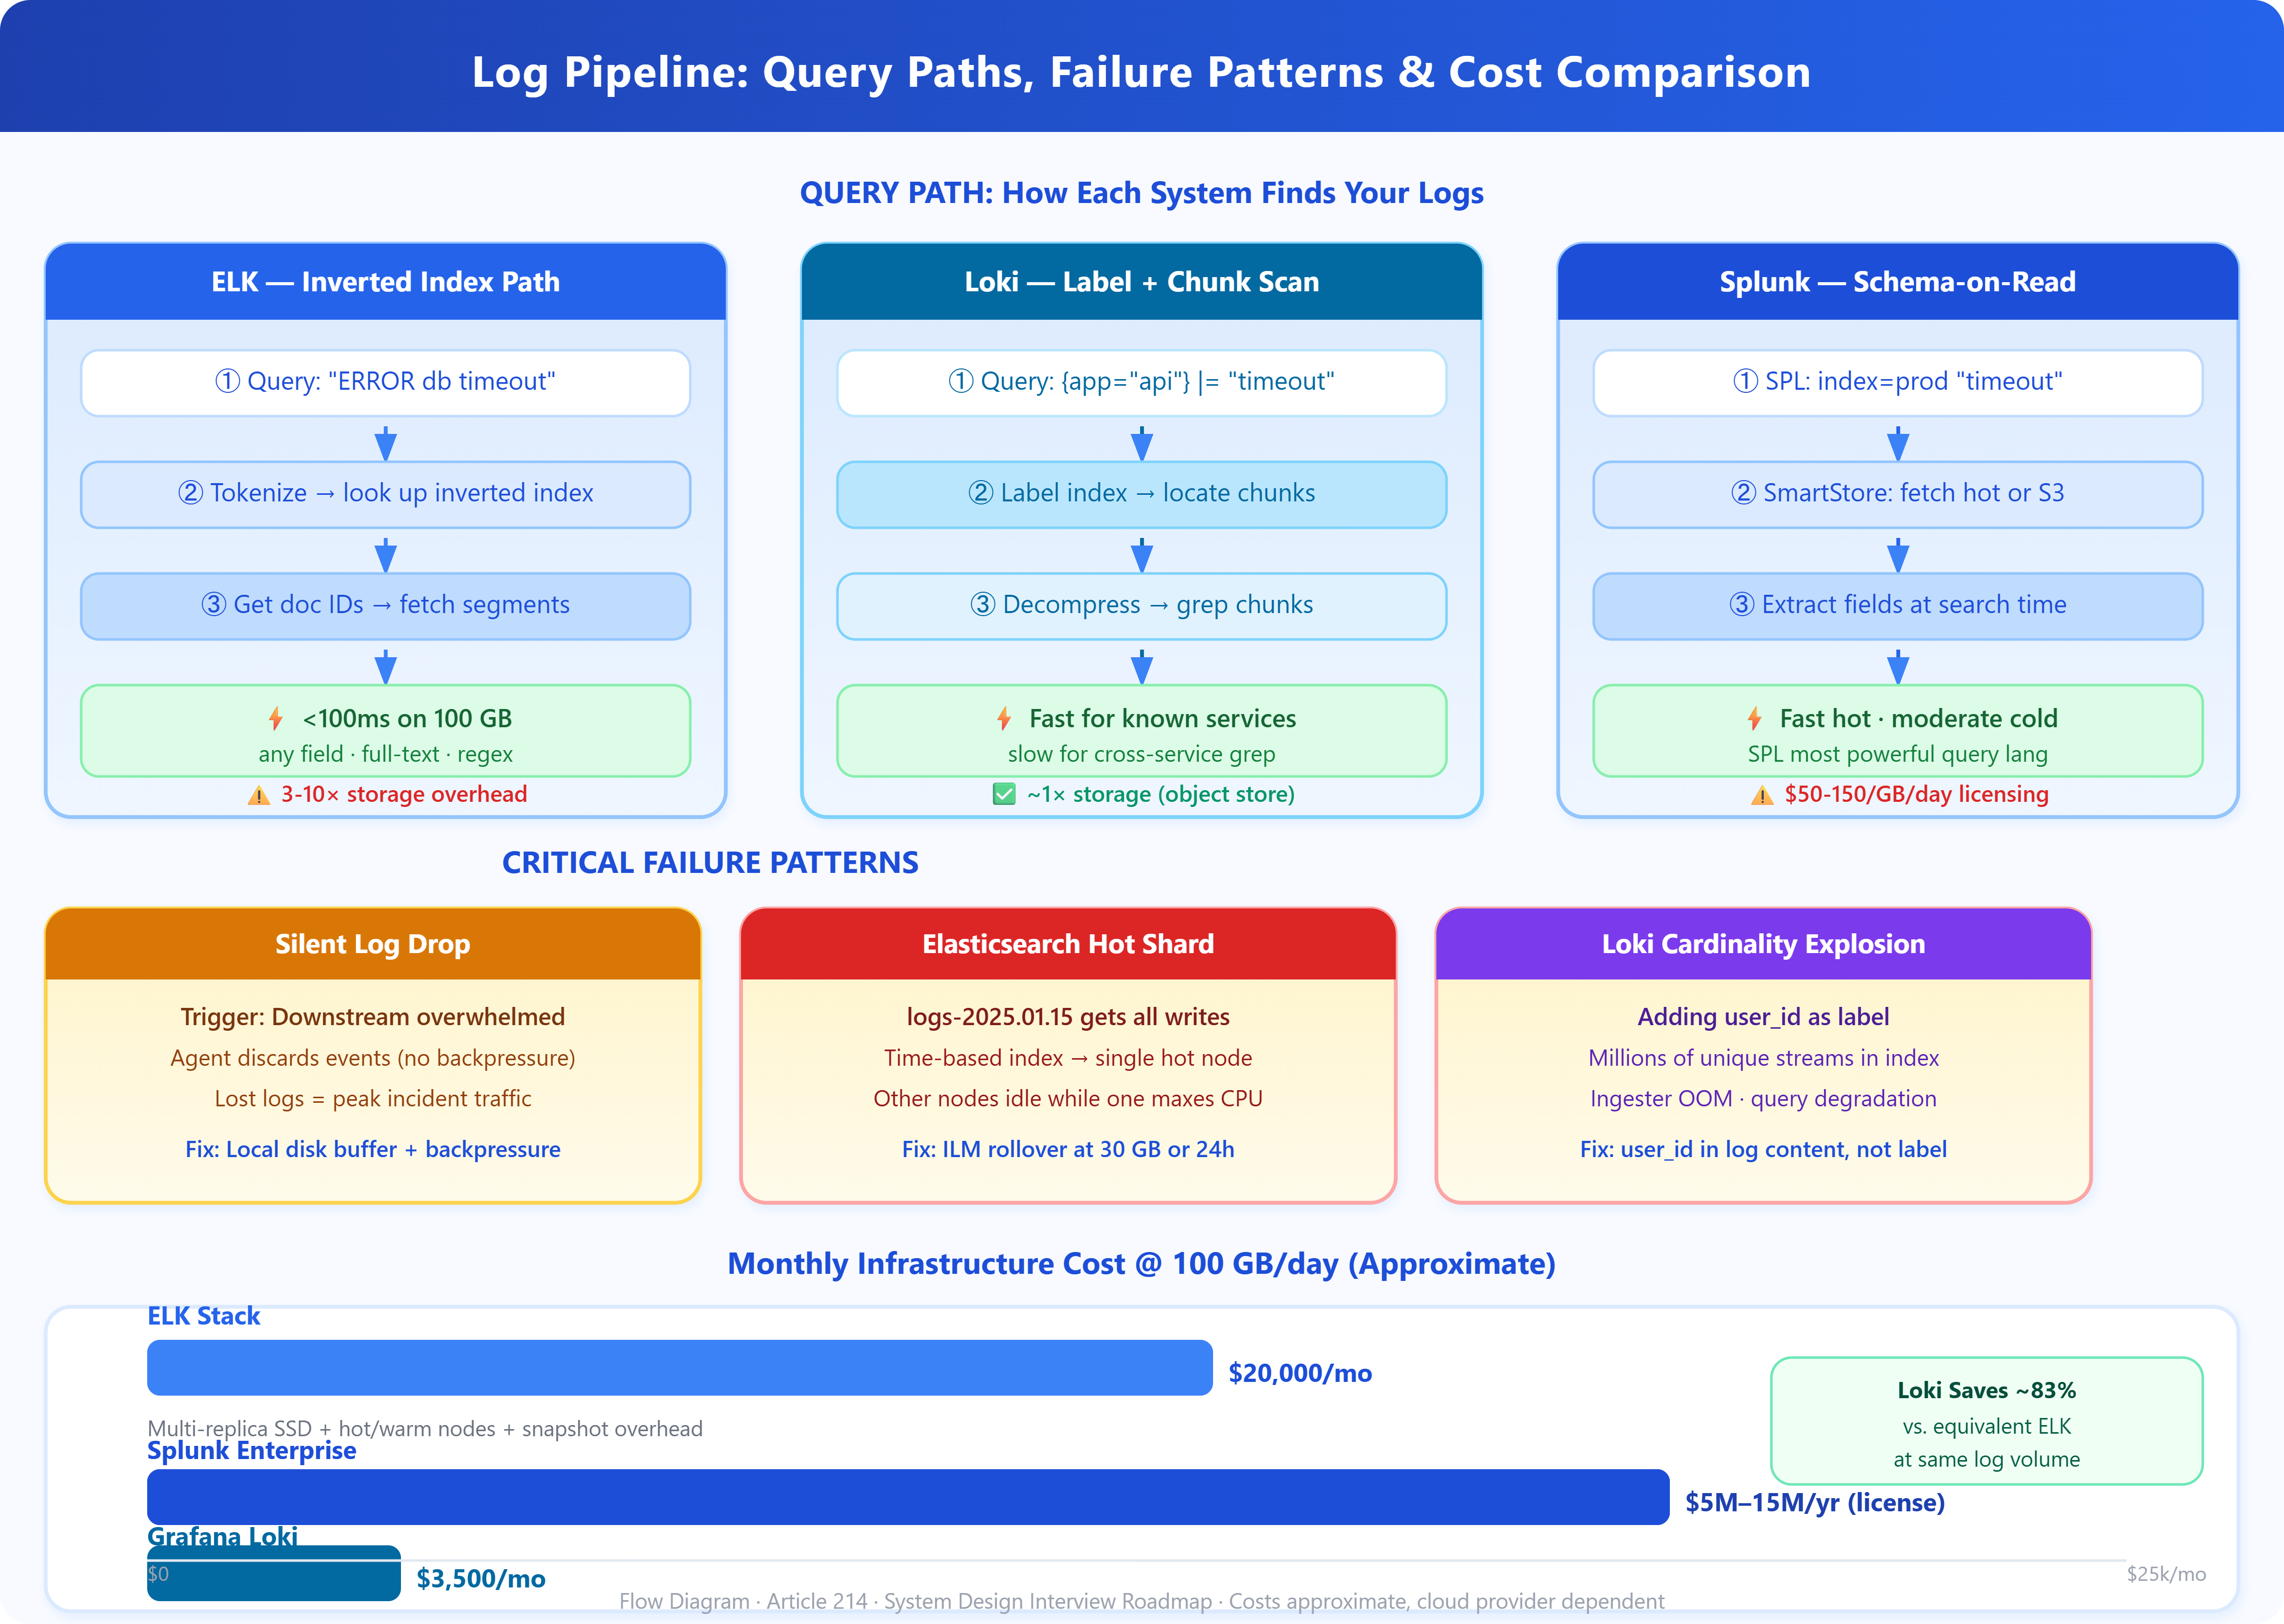
The Collection Layer is where agents like Filebeat, Promtail, or Splunk Universal Forwarder tail log files or consume stdout/stderr from containers. These agents buffer locally (critical for handling backpressure), add metadata (hostname, container ID, Kubernetes labels), and ship upstream. The key failure mode here is the “silent drop” — when the downstream ingestion endpoint is overwhelmed, poorly configured agents discard logs rather than applying backpressure. You lose exactly the logs you need most: the ones generated during an incident when traffic spikes.
The Ingestion Layer (Logstash, Fluentd, or Splunk Indexers) performs parsing, enrichment, and routing. This is where unstructured log lines become structured JSON documents. At scale, this layer becomes a bottleneck. A single Logstash pipeline on modest hardware handles roughly 10,000-50,000 events/second. Facebook’s internal systems process petabytes of logs daily — they’ve replaced traditional parsing pipelines with stream processors that apply schema-on-read rather than schema-on-write, deferring expensive parsing until query time.
The Storage and Index Layer is where the three major architectures diverge fundamentally.
ELK Stack (Elasticsearch, Logstash, Kibana)
Elasticsearch uses an inverted index on every field by default. When you ingest a log line, Elasticsearch tokenizes every string value and creates a lookup from token → document IDs. This makes full-text search blazing fast — querying “ERROR database connection” across 100GB of logs takes milliseconds. The cost: indexing overhead is enormous. Elasticsearch uses approximately 3-10x the raw log size in index storage. A 1TB/day log pipeline requires 3-10TB of SSD storage — and Elasticsearch performs poorly on spinning disks.
The shard architecture adds operational complexity. An index is split into shards, and each shard is a self-contained Lucene index. Too few shards and you bottleneck on single-node write throughput. Too many shards (over-sharding) causes cluster state overhead that degrades all operations. The golden ratio that works in most production clusters: shard size between 10-50GB, with 1-2 primary shards per node’s CPU core count.
Splunk
Splunk is architecturally similar to ELK but adds a proprietary compressed index format and a more powerful query language (SPL). Its key differentiator is schema-on-read: Splunk extracts fields at search time rather than index time. This makes ingestion faster but search slower for first-time queries. Splunk’s SmartStore tiering (hot/warm/cold to S3) is genuinely excellent for cost management — organizations commonly achieve 70-80% storage cost reduction by moving 90-day+ data to object storage.
The hidden cost is licensing. Splunk’s volume-based pricing ($50-150/GB/day for enterprise licenses) makes it the most expensive option at scale. At 500GB/day ingestion, annual costs can exceed $10M. This is why large organizations often run Splunk for security/compliance workloads (where its SIEM capabilities justify cost) and migrate general application logs to ELK or Loki.
Grafana Loki
Loki takes a fundamentally different approach: it only indexes labels, not log content. A Loki stream is identified by a set of key-value labels (
{app="payments", env="prod"}). The log lines themselves are stored compressed in chunks in object storage (S3, GCS) without content indexing.
This makes Loki dramatically cheaper — storage costs are close to raw log size, often 10-20x cheaper than Elasticsearch at equivalent volume. The trade-off is query performance. To search log content, Loki must decompress and scan chunks sequentially. A grep-style query across 24 hours of logs on a single service is fast (it finds the right chunks via label index). A query across all services for a specific string pattern requires scanning everything — and is orders of magnitude slower than Elasticsearch for that access pattern.
Loki’s architecture is intentionally Kubernetes-native. Its label model mirrors Prometheus labels, making it trivially easy to correlate metrics and logs on the same infrastructure. The logcli tool and LogQL query language will feel immediately familiar to anyone using PromQL.
A message from our partner
Struggling to Learn distributed Systems with Go?
Building advanced applications is incredible, but keeping them scaling smoothly under real load is where engineering mastery lives. Learn how to construct high-performance infrastructures using Google’s Go language, or master deep diagnostic tactics for tracking down complex runtime failures in live, distributed Java environments.
Stop guessing when exceptions hit production. Level up your skill set from standard script execution to architecture-level systems engineering.
Critical Insights
1. Cardinality Is the Killer (Loki): Loki’s index contains all unique label combinations. If you add user_id or request_id as a label, you explode cardinality — potentially millions of unique streams. This causes memory exhaustion in the ingester and dramatically degrades query performance. Keep label cardinality under 10,000 unique values per label dimension. User IDs belong in log content, not labels.
2. Elasticsearch Split-Brain Is Underestimated: When the cluster loses quorum (network partition, node failure during rolling restart), Elasticsearch can enter split-brain: two cluster halves both believe they are primary. Both accept writes. When the partition heals, one side’s data is lost. The mitigation is setting minimum_master_nodes = (N/2)+1 — but many teams run with defaults and discover this during their worst incident.
3. Logstash Memory Leaks in Pipeline Restarts: Logstash uses the JVM with a persistent queue on disk. During unclean restarts (OOM kill, SIGKILL), the queue can become corrupted. Events between the last checkpoint and the crash are reprocessed (duplicates) or lost (if queue corruption is severe). Switching to Filebeat + direct Elasticsearch ingest pipelines eliminates Logstash as a single point of failure — and reduces the pipeline’s memory footprint by 60-80%.
4. The Hot Shard Problem (Elasticsearch): If all your services use time-based index names (logs-2025.01.15), all write traffic hits today’s index. The shards for today’s index receive 100% of writes while yesterday’s shards sit idle. Index lifecycle management (ILM) with rollover policies (roll when shard hits 30GB or 24h) distributes writes more evenly and prevents the “hot shard” bottleneck.
5. Retention Policy Mismatch: Most teams set a single retention policy. Production reality: security logs need 1-year retention (compliance), application debug logs need 7 days (cost), and business metrics need 90 days (analytics). ELK’s index-per-service-per-retention-tier architecture and Loki’s label-based bucket policies both support this — but require explicit configuration. Defaulting to uniform retention is a significant hidden cost.
6. Structured Logging Multiplier Effect: Teams that enforce structured JSON logging (every log line is valid JSON with consistent field names) get dramatically better results from any aggregation system. Field extraction at parse time is zero-cost. Ad-hoc grok pattern matching on unstructured text adds 30-50% CPU overhead to Logstash/Fluentd pipelines and produces inconsistent results when log formats change.
Real-World Examples
Uber’s Migration Away from Elasticsearch: Uber ran one of the largest ELK deployments in the industry — 600TB+ of log data. They hit fundamental limits on reindexing speed during schema migrations and cluster-wide query performance degradation during peak traffic. Their solution was a hybrid: ELK for recent 7-day hot data (fast search), Apache Hive on HDFS for cold storage (cheap retention). This pattern — tiered storage with different query semantics per tier — is now standard at hyperscale.
Cloudflare’s Loki Adoption: Cloudflare handles ~50 million HTTP requests/second across their edge. Their logging pipeline using Loki with label-based routing reduced storage costs by 85% compared to their previous Elasticsearch deployment, at the cost of accepting slower ad-hoc content searches. For their use case (known-structure queries, metric correlation, alerting), this trade-off was acceptable.
Splunk for Security, Not Application Logs: JPMorgan Chase and similar financial institutions maintain Splunk exclusively for SIEM workloads — security event correlation, compliance reporting, and anomaly detection where SPL’s power and Splunk’s security content library justify the cost. Application performance logs run on ELK with cold-tier archival to S3 via Searchable Snapshots.
Architectural Considerations
Log aggregation integrates directly with your alerting layer — Kibana/Grafana can trigger PagerDuty alerts on log patterns, but this creates a hidden coupling between storage availability and incident response. If your log cluster is unhealthy during an incident, you lose both visibility and alerting simultaneously. The mitigation: route critical structured events (errors, exceptions) to a separate, lightweight stream (Kafka + minimal consumer) that feeds alerting independently of the full log pipeline.
Cost modeling matters here. Elasticsearch at 100GB/day ingestion runs approximately $15,000-25,000/month on cloud infrastructure when accounting for multi-replica storage, hot node compute, and snapshot costs. Loki on the same workload runs $2,000-5,000/month. The break-even analysis depends entirely on your query access patterns — if your team runs full-text searches across all services constantly, Elasticsearch’s performance advantage may justify the cost.
Practical Takeaway
GitHub Link
https://github.com/sysdr/sdir/tree/main/Log_Aggregation_at_scale/log-aggregation-demo
The right log aggregation architecture depends on your query patterns, not your log volume. Full-text search across diverse log formats → Elasticsearch. Metric-correlated log tailing on Kubernetes → Loki. Compliance and security analytics with budget → Splunk.
Run the demo:
bash
bash setup.shThe demo spins up a local Loki + Grafana stack alongside a simulated Elasticsearch cluster, with a synthetic load generator producing structured log streams. You’ll see:
Label cardinality impact on Loki query performance in real time
Elasticsearch index hot-shard behavior under write load
Side-by-side query latency comparison for identical workloads
Extend the demo by modifying load-generator/config.json to increase cardinality (add user_id as a Loki label) and watch query performance degrade. This is the single most important failure pattern to understand before deploying Loki in production.
Sponsored Systemdr Distributed Architecture: Preparing for heavy-scale backend interviews or architecting massive infrastructure? Master production-grade concepts with hands-on labs covering high-scale distributed engineering, system design, and algorithmic strategies. Learn more here →