
Service Mesh Performance Costs: The Reality of Sidecar Latency
Introduction
Your service handles 2ms p99 latency. You adopt Istio for zero-trust security and traffic management. Six weeks later, on-call engineers are staring at 11ms p99. The architecture didn’t change. The code didn’t change. Only the mesh did. This is the tax every team pays when they deploy a sidecar proxy, and understanding exactly where that tax comes from — and when it’s worth paying — is what separates architects who build resilient systems from those who debug them forever.
What a Service Mesh Actually Does at Runtime
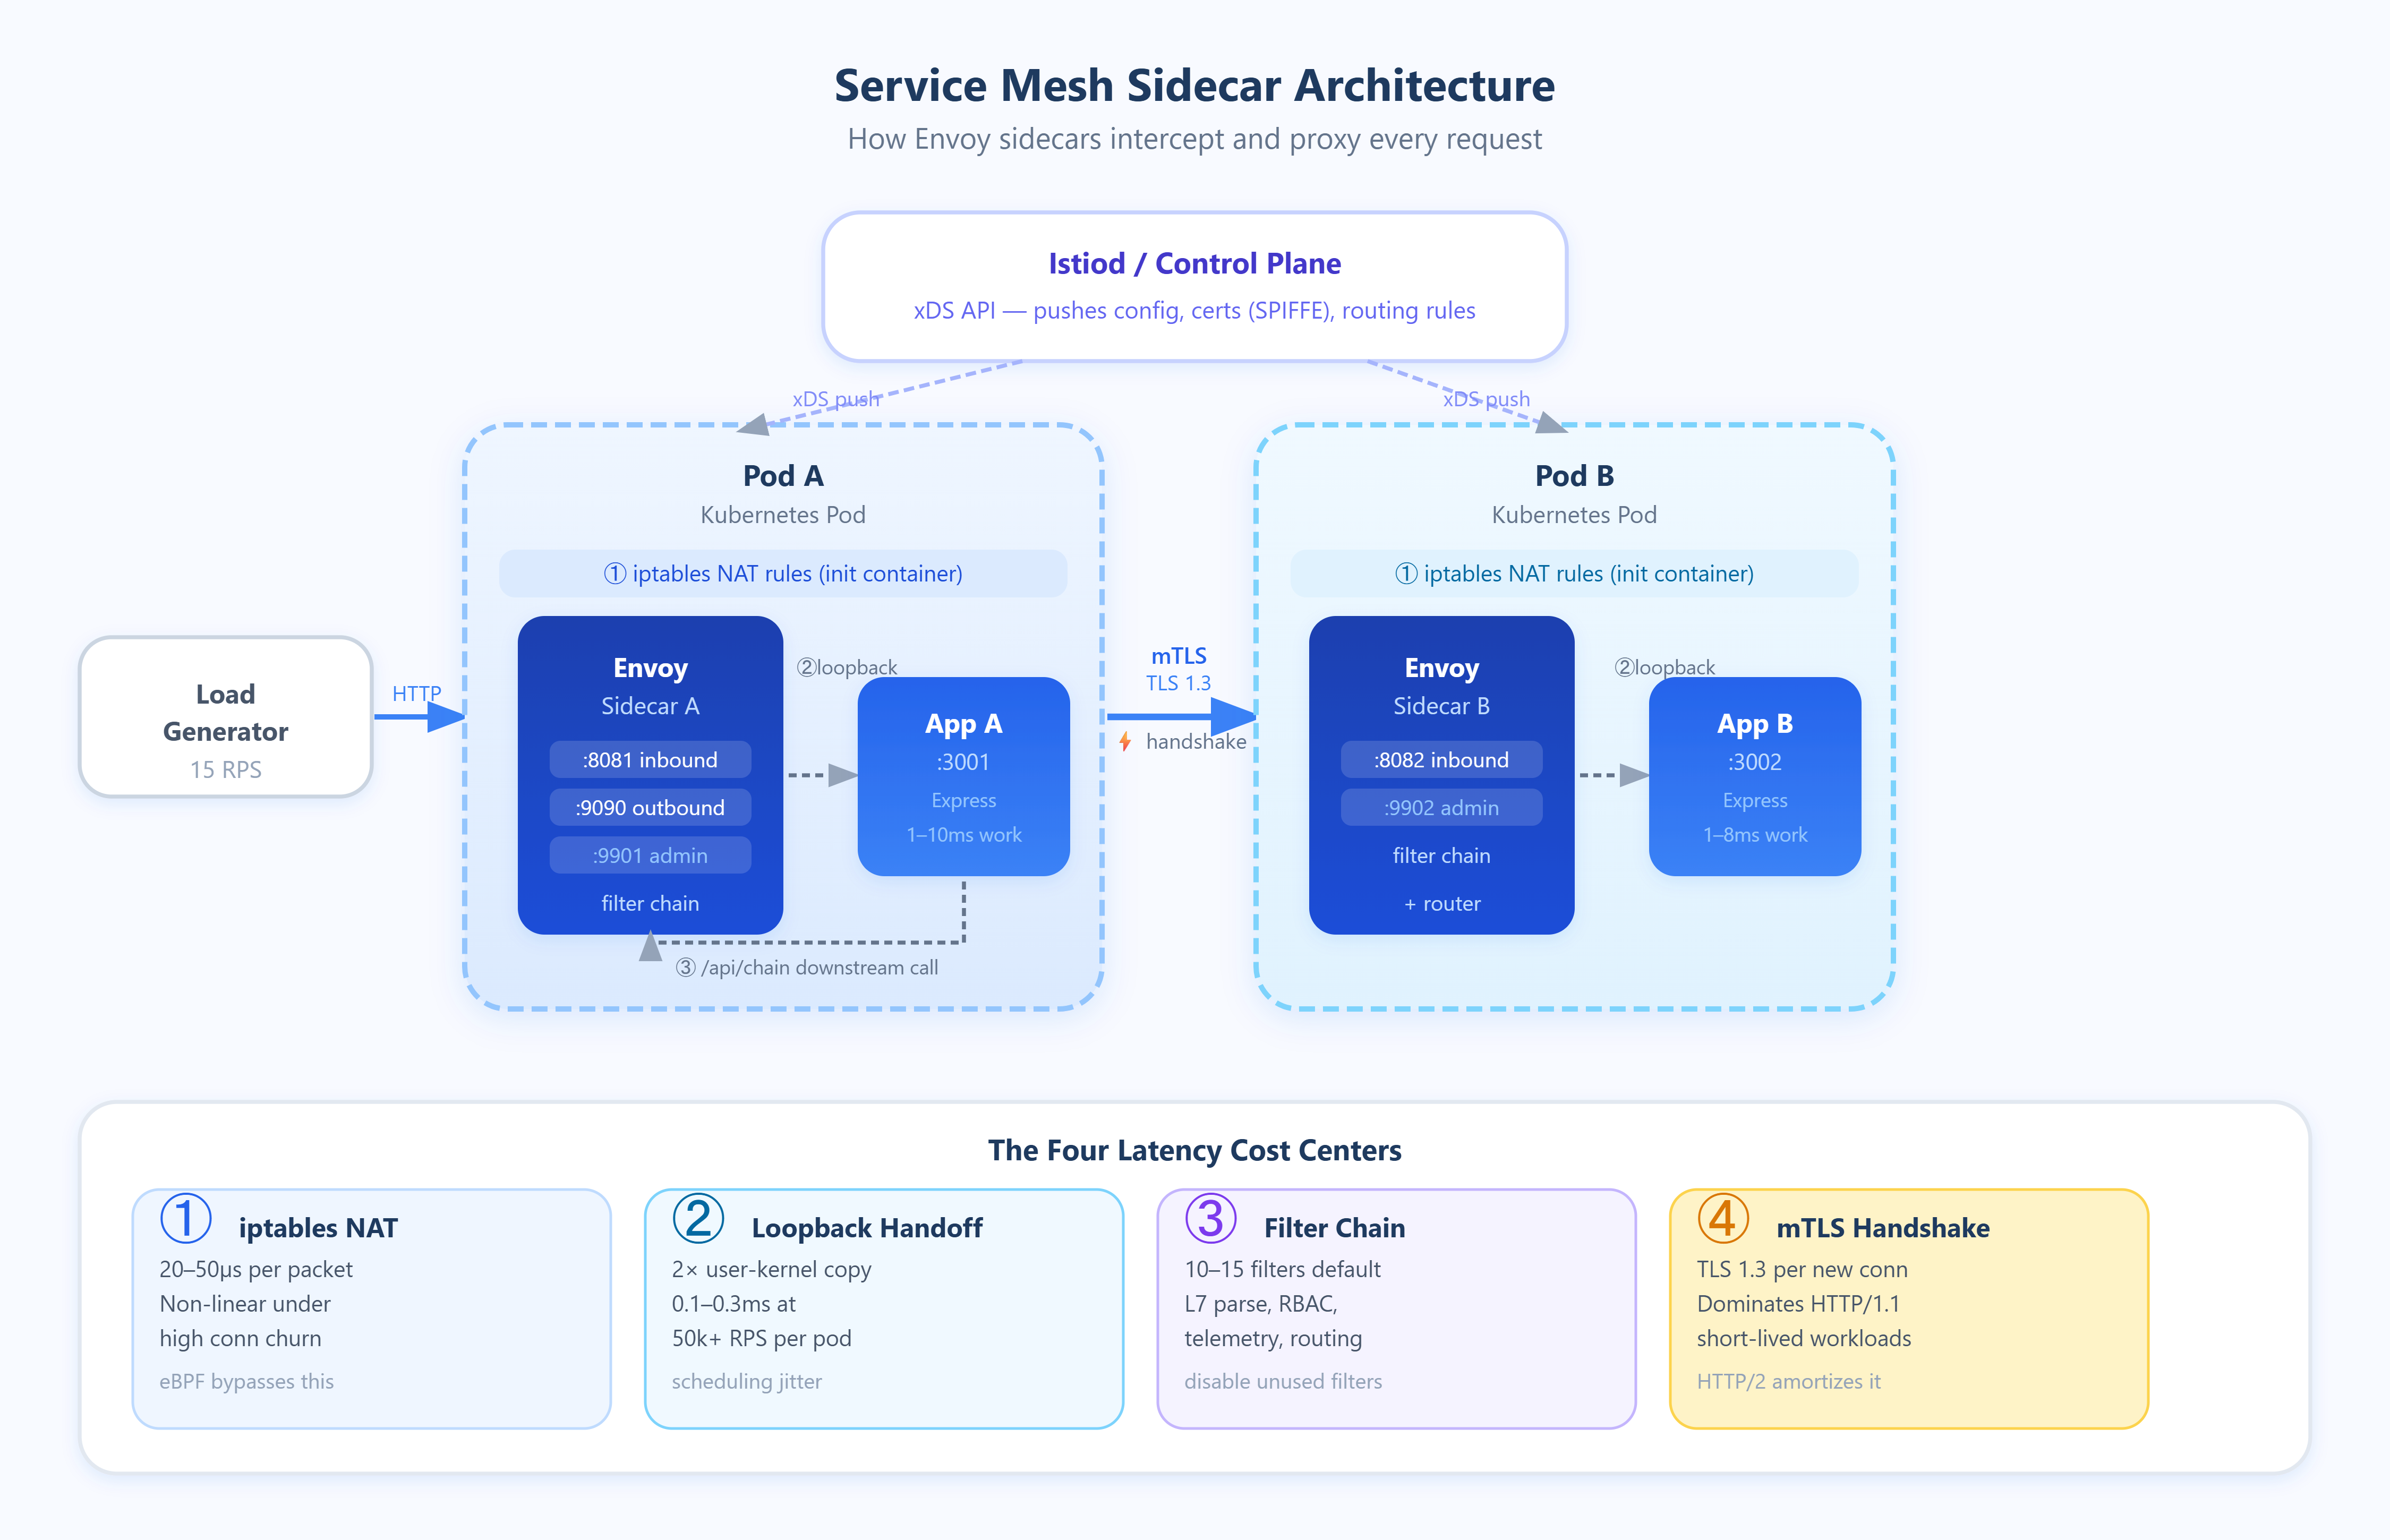
A service mesh inserts a proxy (almost always Envoy) as a sidecar container into every pod. All inbound and outbound traffic is intercepted via iptables rules injected by an init container, redirected to the sidecar on loopback, processed, and then forwarded to the real destination. From the application’s perspective, it’s talking to localhost. From the network’s perspective, every request traverses two additional software stacks.
This interception model creates four distinct latency contributors that compound differently depending on load:
1. iptables traversal cost. Every packet entering or leaving the pod is evaluated against NAT rules injected by the mesh. On a lightly loaded host, this costs roughly 20–50µs per packet. Under high connection churn (hundreds of new connections per second), the cost rises non-linearly because iptables is evaluated sequentially and lacks O(1) lookups for large rule sets. Cilium and eBPF-based meshes (like Cilium Service Mesh) bypass this by attaching programs at the kernel’s XDP or TC layer, reducing this overhead to near zero.
2. Loopback socket handoff. Traffic redirected to the sidecar crosses two user-kernel boundaries — once into the proxy process, and once back out to the destination. Even over loopback, this is a copy operation. At low RPS, this is negligible. At 50k+ RPS per pod, you’re looking at consistent kernel scheduling overhead that adds 0.1–0.3ms of base latency.
3. Envoy request processing. Envoy parses L7 protocol metadata (HTTP headers, gRPC frames), applies routing rules, enforces rate limits, evaluates RBAC policies, and records telemetry. Each filter in the chain adds processing time. A standard Istio deployment activates 10–15 Envoy filters by default. Disabling unused filters (e.g., envoy.filters.http.cors when CORS is handled upstream) directly reduces this cost.
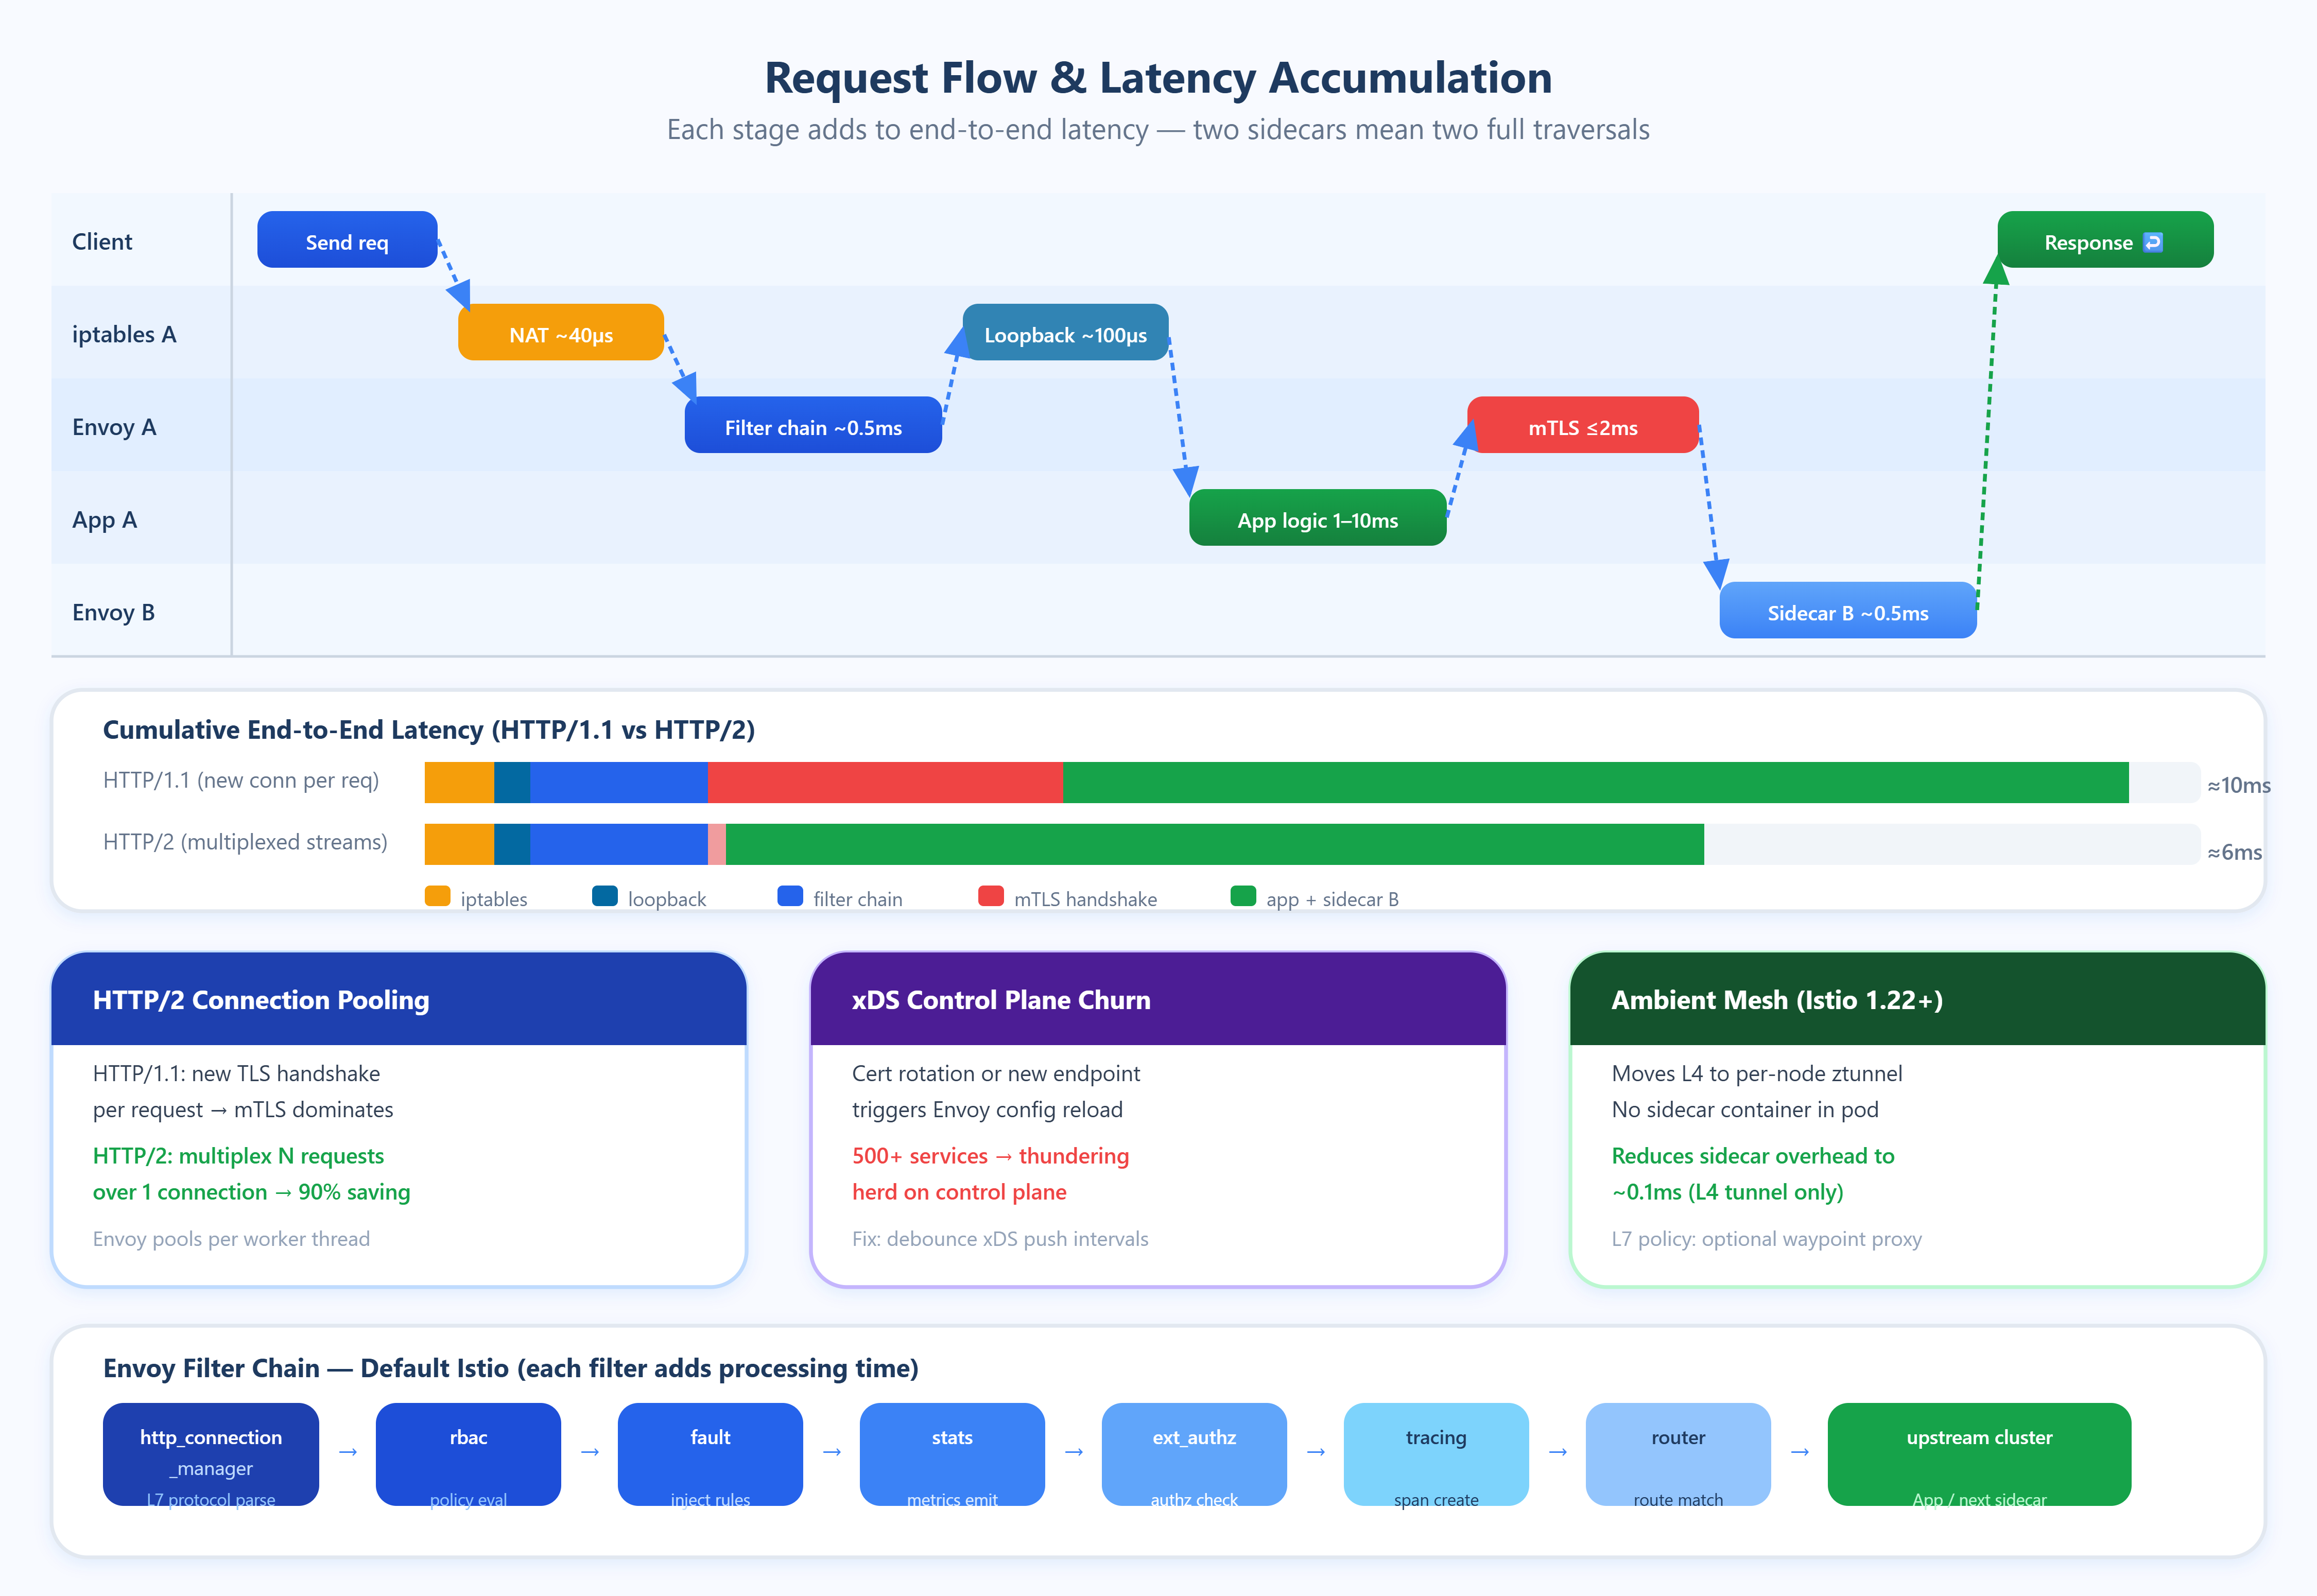
4. mTLS handshake amortization. Mutual TLS between sidecars requires a full TLS 1.3 handshake for new connections. For long-lived connections, this cost is amortized across thousands of requests. For short-lived connections — HTTP/1.1 workloads that open a new connection per request — mTLS overhead can dominate total service-to-service latency.
Critical Insights
Connection pooling is the most underutilized optimization. Envoy maintains separate connection pools per upstream cluster per worker thread. With 4 Envoy worker threads and 20 upstream instances, Envoy can hold 80 simultaneous connection pools. If your application uses HTTP/1.1 without persistent connections, Envoy cannot pool effectively and will perform a TLS handshake for nearly every request. Switching to HTTP/2 or gRPC enables multiplexed streams over single connections, reducing TLS overhead by 90%+ in high-request-rate scenarios.
Control plane churn is a hidden latency spike source. Every time xDS (the Envoy configuration API) pushes an update — a new endpoint, a changed routing rule, a certificate rotation — Envoy must reload affected configuration. During reload, in-flight requests using stale configuration can be dropped. In large clusters (500+ services), certificate rotation events from SPIFFE/SPIRE can trigger near-simultaneous xDS updates across all sidecars, creating a thundering herd on the control plane. Istio’s PILOT_ENABLE_EDS_DEBOUNCE and similar flags exist specifically to batch these updates.
Telemetry cardinality is a CPU amplifier. Envoy emits metrics with labels like source_workload, destination_workload, response_code, and grpc_response_status. At 1000 services with 10 response codes each, the cardinality of the Prometheus time series grows quadratically with the number of service pairs. Teams have reported Envoy spending 15–20% of CPU on stats collection alone at high cardinality. Setting disablePolicyChecks: true for non-critical paths and using metric merging with Prometheus remote write reduces this substantially.
Sidecar resource limits interact with scheduling. Envoy defaults to requesting 100m CPU and 128Mi memory in Istio. Under request pressure, the kernel CPU scheduler may preempt the sidecar mid-processing, adding latency spikes invisible in p50 metrics but glaring in p99.9. Setting CPU limits equal to requests (guaranteed QoS class in Kubernetes) eliminates this variability at the cost of over-provisioning.
The “ambient mesh” architecture eliminates the sidecar problem entirely. Istio’s ambient mode (stable in Istio 1.22+) moves L4 processing to a per-node ztunnel DaemonSet and L7 processing to optional waypoint proxies. Services with no L7 policy incur only node-level tunnel overhead (~0.1ms), not per-pod proxy overhead. This is not a future design — production clusters have validated it.
Real-World Examples
Shopify reported that after adopting Istio at scale (2021), their p99 inter-service latency increased by 3–4ms on average. The root cause was mTLS handshake cost on their Rails services, which used short-lived HTTP/1.1 connections. Their fix was enabling Envoy connection coalescing and mandating HTTP/2 for all internal service communication, reducing handshake frequency by 80%.
LinkedIn published detailed analysis showing that at 2M+ RPS, iptables redirect overhead contributed 8% of total CPU consumption cluster-wide. They migrated to Cilium’s eBPF-based transparent proxy, eliminating iptables NAT entirely and recovering that CPU headroom for application workloads.
Uber addressed control plane scalability by running geographically distributed Istiod instances per region and implementing aggressive endpoint caching. Their finding: with 4000+ services, a naive Istiod deployment received xDS config updates 300+ times per minute, causing Envoy reload storms. Reducing xDS push frequency through debounce tuning cut reload events by 70%.
Preparing for a distributed systems interview? Download the free Interview Pack
→https://systemdrd.com/ebooks/sdcourse-distributed-systems-interview
Subscribe now to access source code repository - 200 + coding lessons → Subscribe
Architectural Considerations
GitHub Link
https://github.com/sysdr/sdir-p/tree/main/Service_Mesh_Performance_costs/sidecar-latency-demo
Service meshes belong in your stack when you need uniform mTLS, traffic splitting for canary deployments, or consistent observability across polyglot services. They do not belong when every microsecond matters — financial systems, gaming backends, or ML inference services should evaluate eBPF-native solutions or application-layer mutual authentication instead.
Monitor proxy resource usage separately from application resources. Envoy’s /stats endpoint and Prometheus integration surface queue depths, connection pool saturation, and filter processing times. Alert on envoy_cluster_upstream_cx_connect_ms p99 as a leading indicator of mTLS overhead before it degrades user-visible latency. Cost-wise, sidecars running at 100m CPU across 500 pods add 50 cores of persistent compute — approximately $2,000–$5,000/month on major cloud providers at standard pricing.
Practical Takeaway
Before adopting or blaming a service mesh, profile the four cost centers: iptables overhead, loopback socket cost, Envoy filter chain depth, and mTLS connection reuse. Most mesh-related latency problems are solved by three changes: enabling HTTP/2 end-to-end, disabling unused Envoy filters, and tuning connection pool sizes to match your concurrency profile.
Run bash setup.sh to see this in action. The demo deploys two services behind Envoy sidecars and a mock control plane, generating traffic at configurable RPS. The dashboard shows real-time p50/p99/p99.9 latency broken down by sidecar cost component — iptables, TLS handshake, filter processing, and application processing — so you can see exactly where each millisecond goes. Toggle HTTP/1.1 vs HTTP/2 and watch TLS amortization change the latency profile live. Extend it by adding more Envoy filters to the chain and observing additive latency. This is the fastest way to build an intuition for what your mesh is actually costing you.